Silfio Methodology
Silfio uses advanced statistical techniques and artificial intelligence to give a transparent, data-driven view of the financial risk that institutions and investors face from geopolitical conflict. Rather than a single black-box score, the model answers the question in separate, inspectable stages — how often conflict occurs, how severe it could be, where it lands, what it damages, and how that damage translates into financial loss. Each stage below can be read, challenged and stress-tested on its own.
Whitepaper
Silfio: Quantifying Armed-Conflict Risk
Explore the modelling framework, validation evidence and limitations behind Silfio’s conflict and portfolio loss estimates.
Model version 1.1 · October 2026
Step 1
Event
How often: conflict frequency
This stage estimates the chance that a defined conflict begins in a country over the next twelve months. It starts from a base rate — how often conflict has historically begun among countries with similar structural conditions — and then adjusts for what is specific to that country now. The output is a probability with an honest range around it, not a yes/no verdict.
A forward-looking intelligence layer uses AI to extract structured signals from current news coverage. These signals are evaluated by a news-based model fitted on more than 1 million articles published worldwide since 2005, allowing it to capture developments that a slower structural estimate cannot yet reflect. The structural base rate remains the anchor: current events inform the estimate rather than replacing its underlying political, economic and social foundations.

Step 2
Hazard
How severe it could be
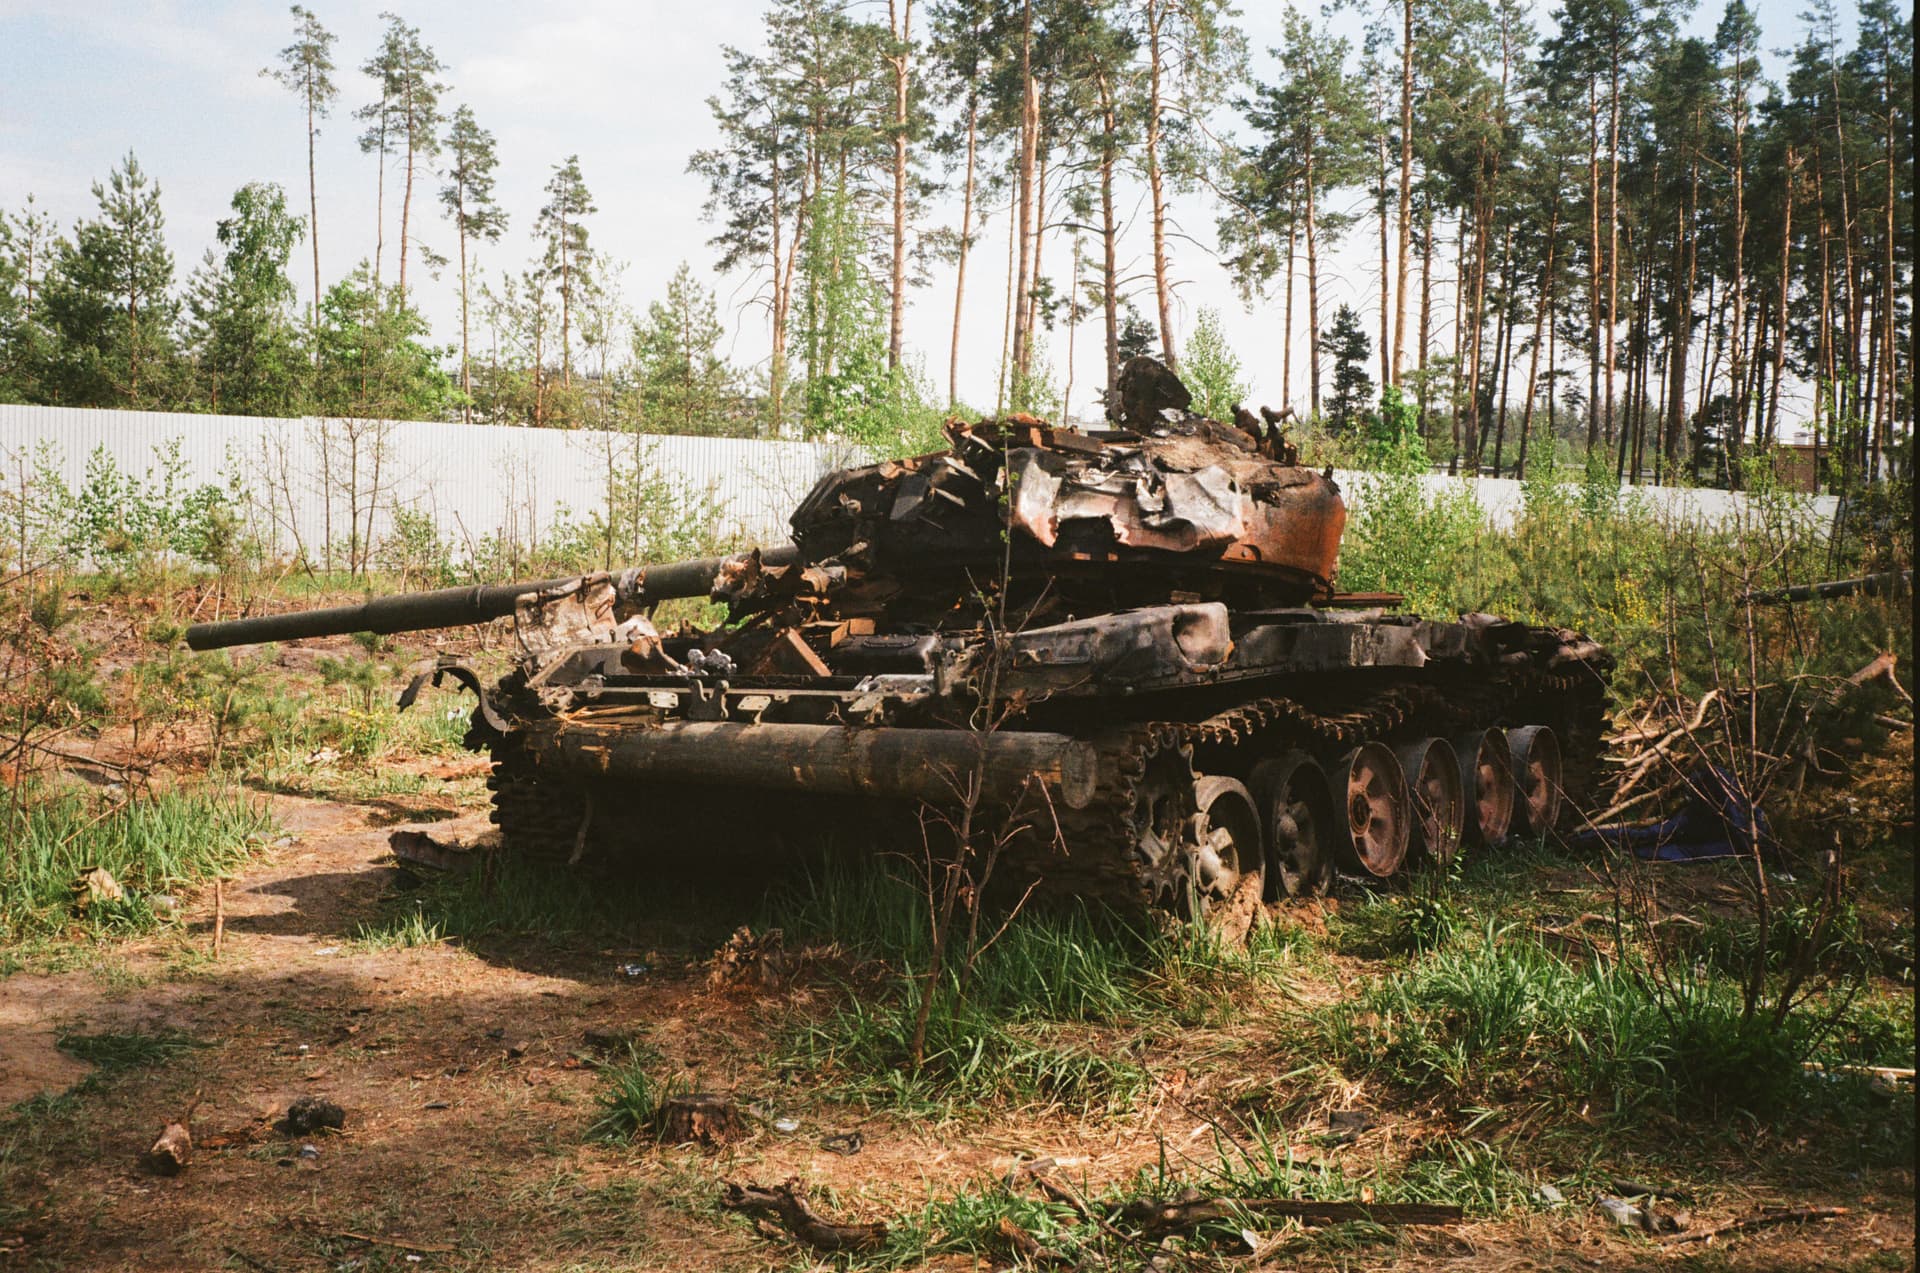
Given that a conflict occurs, this stage estimates how intense it could be — both physical destruction and economic disruption such as slower growth, higher inflation and falling markets. As with frequency, the result is a distribution of plausible outcomes rather than a single number.
Severe physical damage and severe economic stress are modelled to move together, because real crises are correlated. The model is not allowed to assume the worst outcomes are independent — the assumption that most often flatters a risk estimate.
Step 3A
Inventory
Where it lands: likelihood of property impact
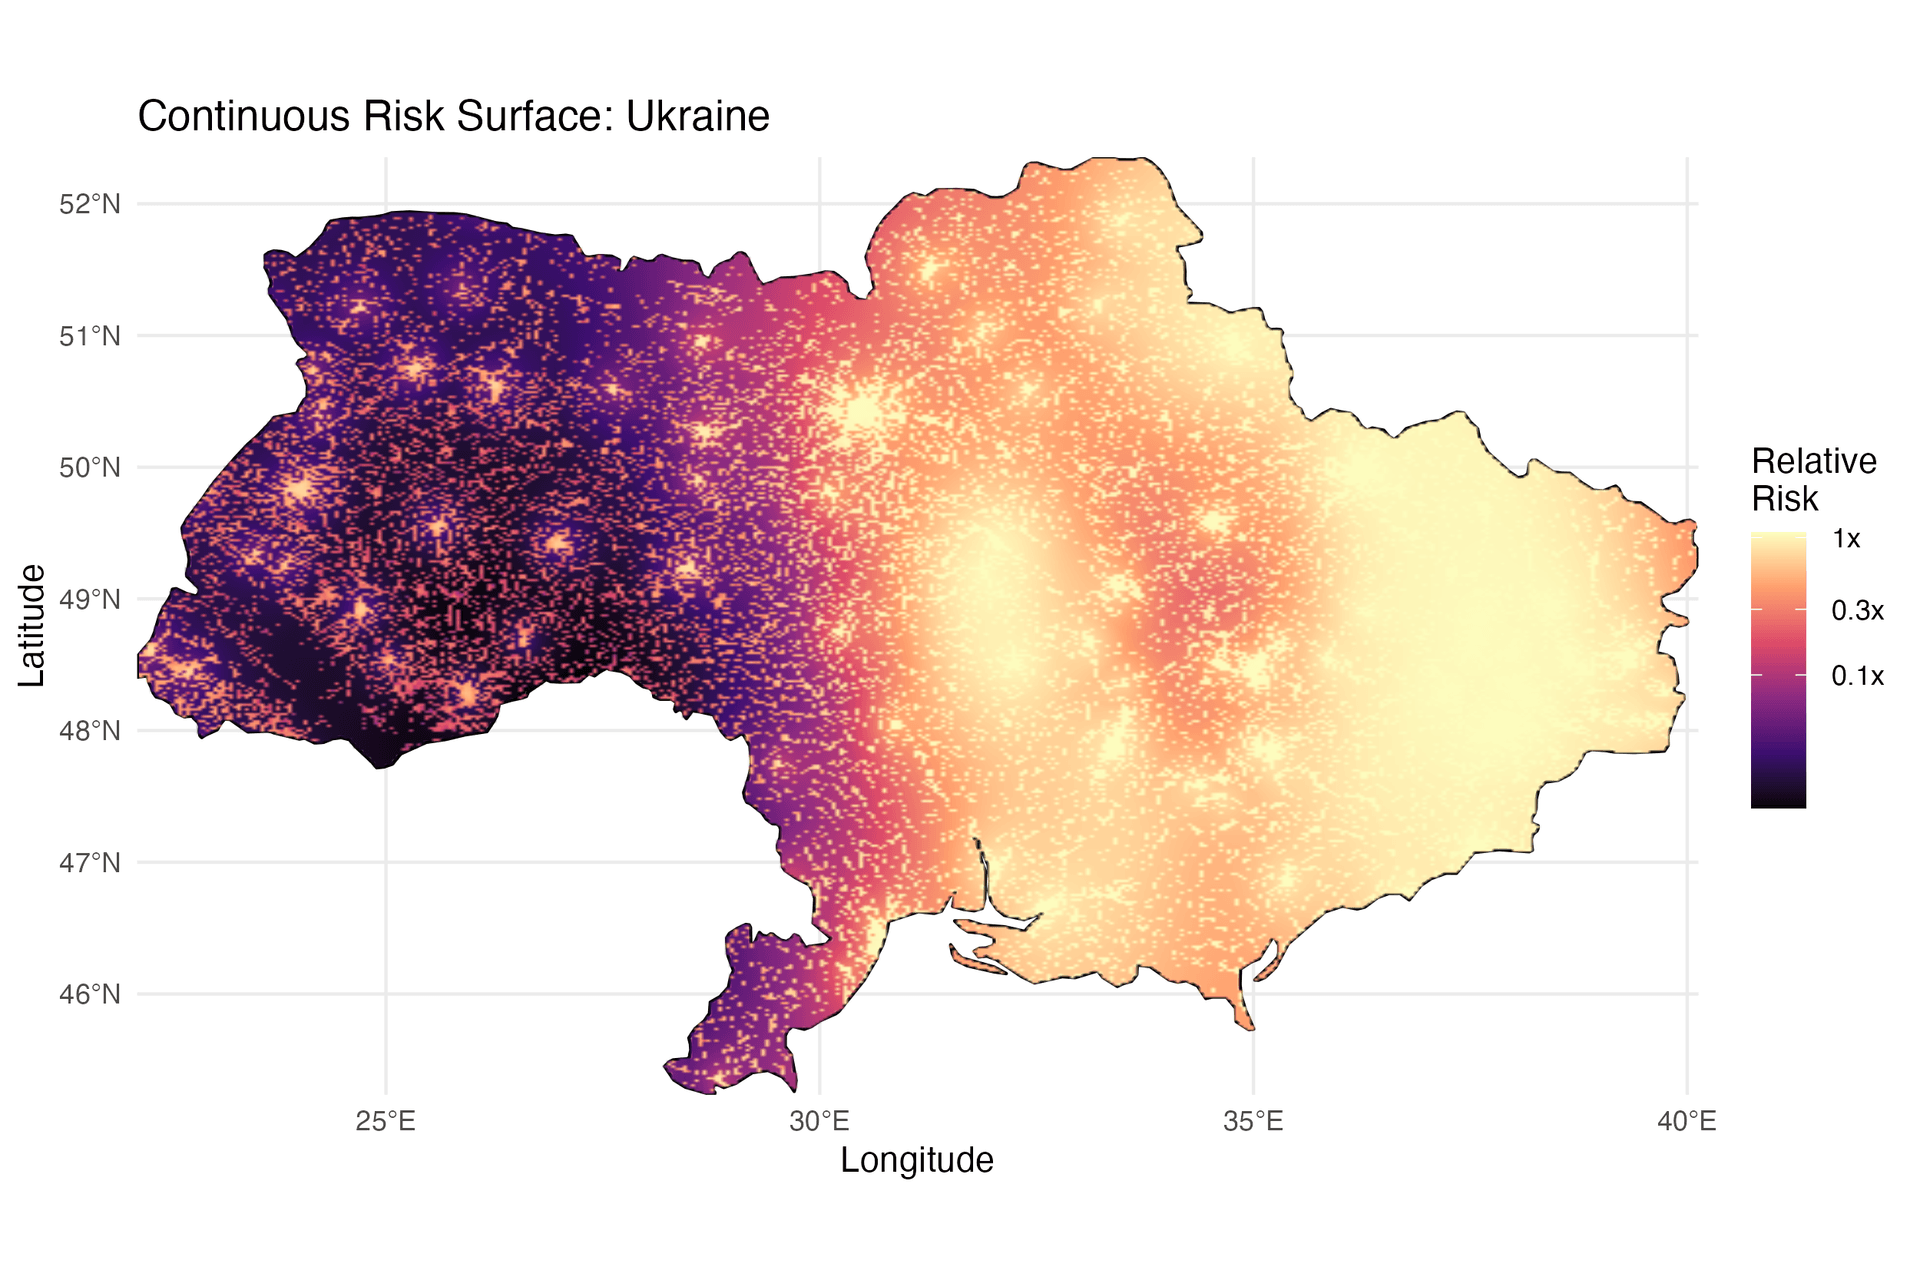
Conflict intensity is not spread evenly within a country. Each property's coordinates and building use help translate national damage estimates into local hit likelihoods, using historical conflict hotspots and features such as urban development, city importance and proximity to borders.
Each simulation concentrates fighting into theatres — areas around peaks in the local risk surface — then varies damage across districts within them. These layers reflect patterns in historic conflict records. A portfolio concentrated in one city therefore behaves differently from one spread across the country.
The model also simulates subthreshold events: episodes of organised violence that fall below the qualifying conflict threshold and are typically smaller in scale and shorter in duration.
Step 3B
Investment
Financial holdings under stress
Financial holdings are shocked by the same conflict scenario as the physical portfolio, so the two stay consistent. Rather than a single haircut, the model assesses several distinct channels through which value is lost and combines them:
- Market risk — how equity and asset prices move under conflict-driven stress.
- Credit risk — the effect of wider credit spreads on bonds and similar instruments.
- Currency risk — the impact of inflation and exchange-rate pressure on holdings.
- Default risk — the chance an issuer fails to pay, and the loss if it does.
How to read these figures
These channels are calibrated on historical market data, and that data is noisy: prices move for many reasons at once, and conflict episodes coincide with rate moves, commodity shocks, policy responses and global risk sentiment. A market drawdown is not cleanly separable from the other forces acting on the same prices.
Silfio reports investment results as losses under a conflict-consistent market scenario.
Step 4
Vulnerability
What breaks: damage given a hit
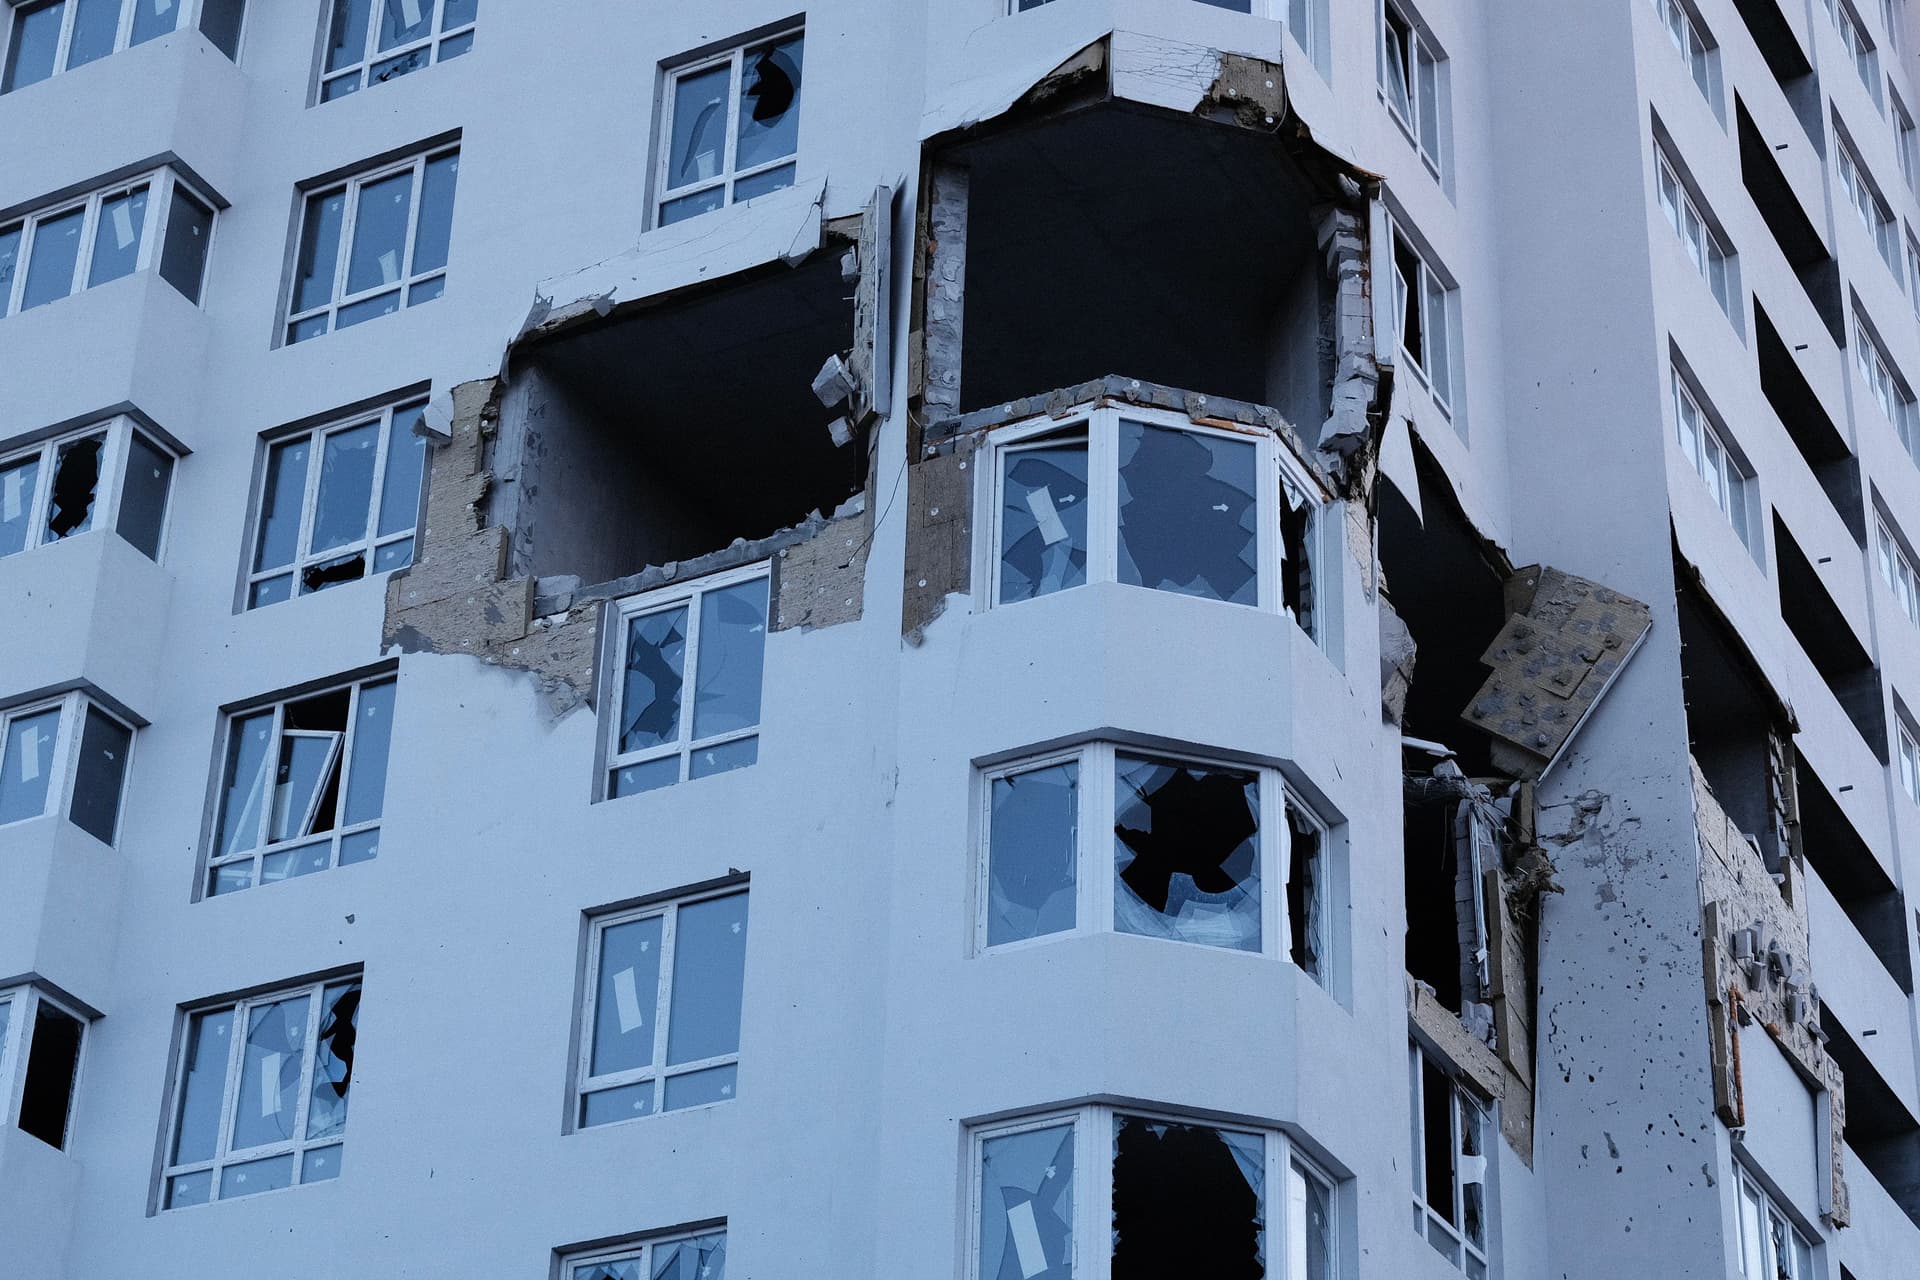
Given that a property is hit, this stage estimates how much damage it takes (throughout the time-frame), based on its characteristics — floor area, building height, construction and use. The same event can leave two neighbouring buildings very differently affected.
Damage is expressed as a proportion of value, so it applies consistently across properties of different sizes and can be carried cleanly into the financial stage.
Step 5
Financial
From damage to net loss
Physical damage is only the starting point; what an organisation actually retains depends on its insurance. This stage converts damage into a ground-up loss — the value at risk multiplied by the damage taken — then applies the policy structure in the correct order: any underinsurance penalty, deductibles and attachment points, occurrence limits, the insurer's participation, and the reinsurance layers above.
These terms are deliberately nonlinear, which is why they must be modelled rather than approximated. A modest change in total loss can cross an attachment point and sharply change the split between insured, insurer and reinsurer — behaviour a flat loss percentage cannot reproduce.
Time horizon: the next twelve months
Silfio models a forward-looking horizon of one year. Every probability, severity and loss figure describes what could happen over the twelve months from the run date, consistent with the annual basis on which political-violence cover and most risk-capital decisions are set.
A conflict that begins partway through the year is measured over the remaining part of that annual window rather than a full year, so partial-year exposure is handled explicitly instead of being assumed away.
Stochastic simulation and results
The whole pipeline is run many times as a stochastic (Monte Carlo) simulation, so every output is a distribution rather than a single figure — carrying both uncertainty about the models themselves and the genuine randomness of rare events. Runs are reproducible, so identical inputs give identical results.
For property and insurance, results are summarised three complementary ways: expected loss, the probability-weighted average across simulations (the technical loss cost before commercial loading); value at risk (VaR), a chosen percentile such as a 1-in-100 year; and tail value at risk (TVaR), the average loss beyond that point, which is more informative for rare, severe events. Each is reported on a ground-up, insured, insurer and reinsurer basis, alongside loss ratios.
The same simulation also returns the impact on financial holdings. For the investment portfolio it reports the expected loss together with the tail measures (VaR and TVaR) and a loss ratio, broken down across the market, credit, currency and default channels — so the effect on investments can be read alongside, and combined with, the property and insurance figures for a single portfolio-wide view of exposure. Those investment figures remain market-based: they describe portfolio outcomes under a conflict-consistent market scenario rather than a loss attributable to conflict alone.
Validation and transparency
To an actuarial standard, a model is judged by evidence. Silfio's components are tested for calibration (do stated probabilities match what actually happens?) and discrimination (do higher-risk cases genuinely fail more often?), validated out-of-sample against outcomes they were not fitted to, and benchmarked against observable market prices and historical experience.
Just as important is honesty about limits: a documented limitation register records where inputs are sparse or noisy and handled conservatively, where tail estimates for very rare territories carry simulation noise, and which extensions remain on the roadmap. Detailed validation and model documentation are available to institutions under appropriate confidentiality for compliance and audit.