Portfolio modelling
From country risk to portfolio loss
Why a country score cannot describe financial exposure, and how separating how-often from how-bad — then running it through your actual assets and contracts — produces expected loss, VaR and TVaR for a specific book.
Two different questions
A country score tells you how likely conflict is; it cannot tell you what you would lose. Getting from one to the other means separating frequency (how often an event occurs) from severity (how bad it is), and then running the result through the specific assets, investments and contracts you actually hold. Crude shortcuts — multiplying every asset value by a country probability, or applying one loss rate across a whole territory — skip that step and mislead.
Real portfolios are heterogeneous. A warehouse, a hotel and a high-rise office respond differently to the same physical event. Two investments in the same country can differ in their sensitivity to currency pressure, sovereign credit deterioration or disrupted trade. Insurance and reinsurance terms then redistribute the total loss between insured, insurer and reinsurer. A portfolio model has to carry those differences through, not average them away.
Frequency and severity, kept apart
The backbone of any sound loss model is to separate frequency from severity, then translate severity into damage and damage into money. Silfio keeps these as distinct, linked stages — event likelihood, severity, where exposure sits, how vulnerable it is, and the financial terms that apply — so a result can be traced to its driver. Reviewers can see whether a number is high because of event probability, a severe scenario, concentrated exposure, fragile assets or thin cover. A single composite score cannot show that.
Severity is also modelled so that severe physical destruction and severe economic stress tend to arrive together, rather than being treated as independent. That matters for any book that spans property and investments, because it stops the model from quietly assuming the bad outcomes are unlikely to coincide.
- Event: the likelihood that a defined conflict occurs — the frequency layer.
- Severity: how intense the physical and economic impact is, given that it occurs.
- Exposure: the assets, holdings and contracts in the affected area, located rather than assumed.
- Vulnerability: how much damage each exposure takes when it is hit.
- Financial: the policy, reinsurance and market terms that determine retained loss.
Location changes the answer
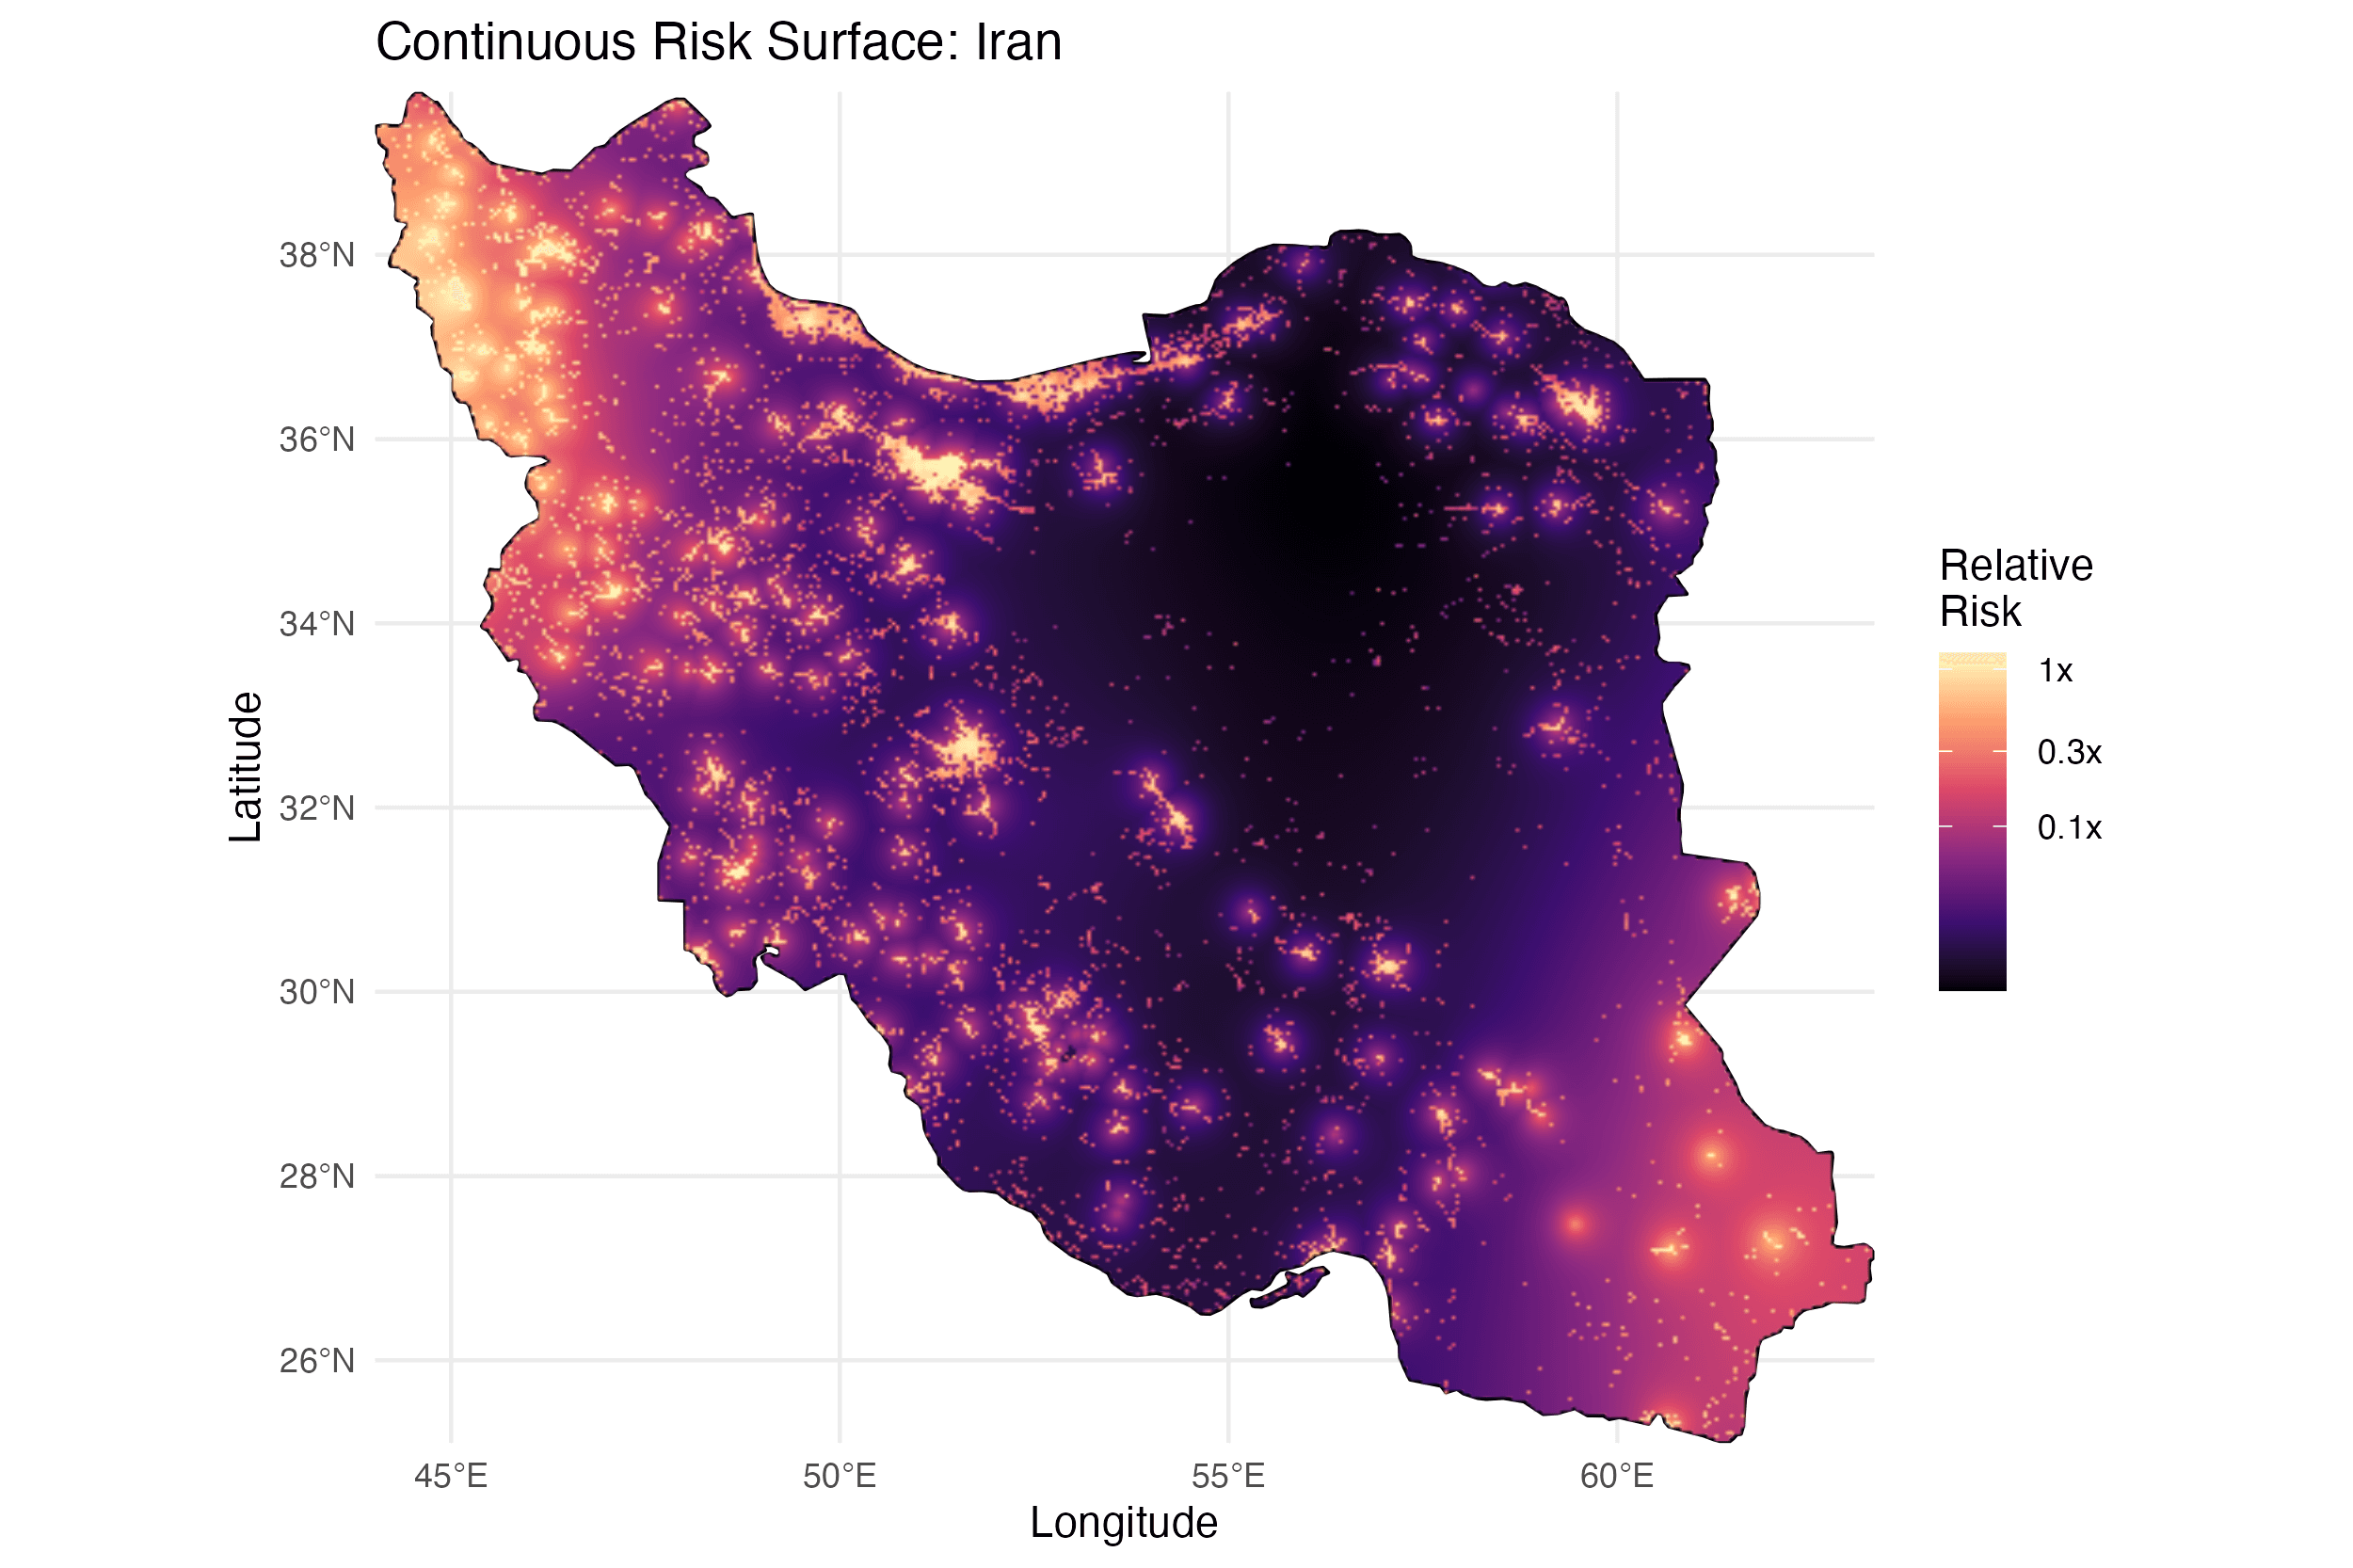
Country averages are useful for comparison but weak for asset-level decisions, because conflict intensity is not evenly distributed within a country. Capitals, border regions, ports and infrastructure can carry very different exposure from quieter areas. Geocoding lets the model distinguish two assets that share a country label but not the same local risk.
Location data still deserves honest precision. A street address does not make the forecast certain, and an exact coordinate cannot remove uncertainty about where an event's footprint falls. The purpose is to improve differentiation between exposures, not to imply an accuracy the underlying event does not have.
Damage becomes dollars through the policy structure
Vulnerability converts a hit – or more precisely, a sum of hits over a time-frame – into a damage ratio, and the financial stage turns that into money. The ground-up loss at a location is its insured value multiplied by that damage ratio. Each location is then run through its insurance programme in the correct order: an underinsurance penalty where the declared value falls short, then deductibles and attachments, occurrence limits, the insurer's participation, and any reinsurance layers above.
These structures are deliberately nonlinear, and that is where a portfolio model earns its keep. A modest increase in gross loss can cross an attachment point and sharply change the split between insured, insurer and reinsurer — behaviour a single loss rate simply cannot reproduce.
Investments shocked by the same event
Financial assets are marked to the same scenario as the physical book, by asset class, so the losses are consistent with one another rather than assembled from separate assumptions. Equities move with a conflict-sensitive market response; bonds reprice for wider credit spreads and interest-rate duration, with an allowance for default; property responds to the economic shock; and cash and foreign-currency holdings pick up currency effects.
The value of doing this in one pass is coherence. When a scenario is severe, it is severe everywhere at once — equity, credit, property and currency — which is exactly the correlation that hurts a diversified portfolio in a real crisis.
Reading the outputs: expected loss, VaR and TVaR
The results are reported three ways, because they answer different questions. Expected loss is the probability-weighted average across simulations — the technical, or pure, loss cost before any market loading. Value at risk (VaR) marks a chosen percentile of the loss, such as the 95th or 99th. Tail value at risk (TVaR), also called expected shortfall, is the average loss beyond that percentile; it is a coherent risk measure and is usually more informative for severe, low-frequency events, because it describes how bad the tail is rather than only where it begins.
Silfio produces these on a ground-up, insured, insurer and reinsurer basis, alongside loss ratios, from a single consistent simulation. Expected loss with market-typical loadings can then be sense-checked against observable market pricing, so the figures are anchored to reality rather than only to internal consistency.
Use scenarios to challenge the model
A probabilistic model supports planning, but decision-makers should also test named scenarios that fix assumptions about severity, affected areas, market shocks or insurance response. Scenarios are especially useful when a committee disagrees with the central estimate but can agree on a plausible stress, and they make the model legible: you can see exactly which lever moved the loss.
The strongest workflow uses both views — probability for consistent measurement, scenarios for exploration, challenge and communication. Together they show not only what the model expects, but what the organisation may need to withstand.